Customers financed $41,445 on the average new-vehicle loan and $27,768 on the average used vehicle loan during the 4th quarter. Those loans on average had higher interest rates and higher monthly payments than a year earlier. Meanwhile, a larger proportion of customers were behind on their loans. Here are more highlights from Experian.
Market share of total financing
Hover over chart for more detail.
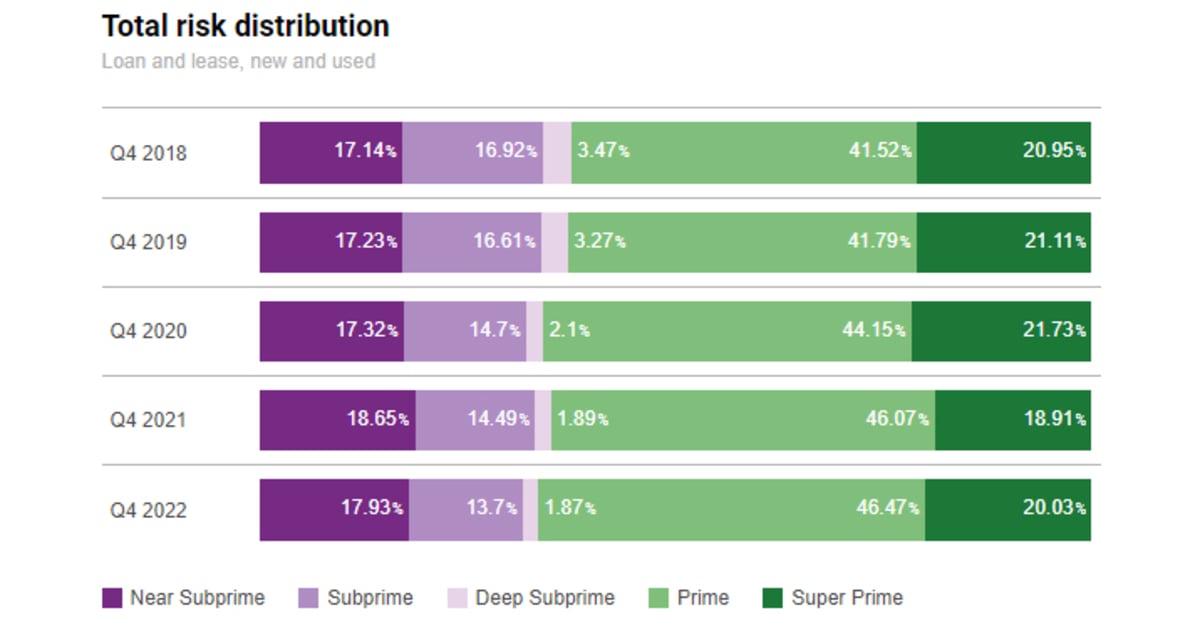
Total risk distribution
Loan and lease, new and used
| Q4 2018 | |
| Q4 2019 | |
| Q4 2020 | |
| Q4 2021 | |
| Q4 2022 |
Near Subprime
Deep Subprime
Super Prime
30-day delinquency
Percentage of loans delinquent
| Q4 2018 | 2.43% | |
| Q4 2019 | 2.42% | |
| Q4 2020 | 1.81% | |
| Q4 2021 | 1.86% | |
| Q4 2022 | 2.31% |
60-day delinquency
Percentage of loans delinquent
| Q4 2018 | 0.83% | |
| Q4 2019 | 0.83% | |
| Q4 2020 | 0.64% | |
| Q4 2021 | 0.66% | |
| Q4 2022 | 0.87% |
New-vehicle loans
Average amount financed
| Q4 2020 | $35,420 | |
| Q4 2021 | $39,834 | |
| Q4 2022 | $41,445 |
Average loan rate
| Q4 2020 | 4.3% | |
| Q4 2021 | 3.88% | |
| Q4 2022 | 6.07% |
Average monthly payment – lease
| Q4 2020 | $469 | |
| Q4 2021 | $535 | |
| Q4 2022 | $578 |
Average monthly payment – loan
| Q4 2020 | $578 | |
| Q4 2021 | $646 | |
| Q4 2022 | $716 |
Average term – lease (In months)
| Q4 2020 | 36.49 | |
| Q4 2021 | 36.74 | |
| Q4 2022 | 35.42 |
Average term – loan (In months)
| Q4 2020 | 69.63 | |
| Q4 2021 | 69.64 | |
| Q4 2022 | 69.44 |
Used-vehicle loans
Average amount financed
| Q4 2020 | $22,643 | |
| Q4 2021 | $27,390 | |
| Q4 2022 | $27,768 |
Average loan rate
| Q4 2020 | 8.41% | |
| Q4 2021 | 8.22% | |
| Q4 2022 | 10.26% |
Average monthly payment
| Q4 2020 | $417 | |
| Q4 2021 | $490 | |
| Q4 2022 | $526 |
Average term (In months)
| Q4 2020 | 65.66 | |
| Q4 2021 | 67.35 | |
| Q4 2022 | 68.01 |
SOURCE: Experian