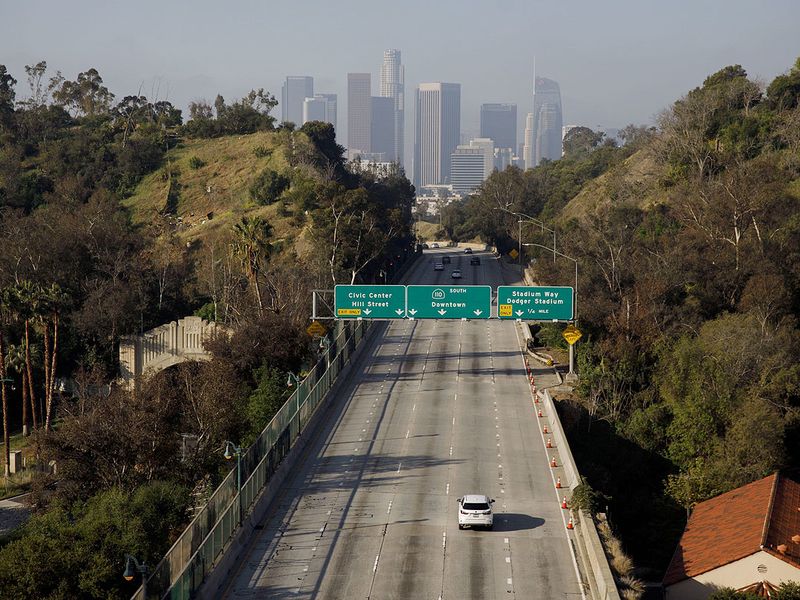
New data is shedding light on just how much the coronavirus pandemic has kept people from traveling.
In the U.S., the disruption hit a peak in early April, when people reduced their total miles traveled by half across all surface modes of transportation, according to Arity, a mobility and data analytics company.
Since then, the company has seen a gradual uptick in travel. Total miles traveled had returned to 62 percent of previous norms on May 9.
But the broad picture masks considerable differences; the pandemic’s impact on travel has varied from state to state.
Some saw a drop in overall miles traveled as precipitous as 70 percent while others declined as little as 23 percent from previous levels.
Gary Hallgren, president of Arity, says what constitutes a recovery looks different from one region to another.
Wyoming’s traffic has recovered to near pre-pandemic norms, while Washington, D.C., remains 70 percent below its norms.
“The way we’re seeing states reopen, we’re seeing even more dramatic swings,” he said.
“I don’t know if we have answers as to why yet, but we’re looking to see if it’s tied to orders the states are giving, or is it really how people feel and human behavior making a bigger difference. Time is going to tell.”
Arity’s data suggests there is a subset of drivers whose habits have bucked the overall trends: About 12 percent of drivers have increased their mileage during the pandemic, driving about 19 percent farther on their trips.
The cause may be unclear, but Hallgren posits that people who lost jobs are finding new work in gig-economy positions or there’s an increase in demand for delivery services.
Arity, started by Allstate in 2016, analyzes data from about 23 million anonymized sources across multiple modes of surface transportation and collects roughly 1 billion miles worth of driving data every two days.
In terms of road safety, the company has detected both reassuring and troubling trends.
Harsh accelerations have declined 10 percent from pre-crisis levels. But since March 13, the company has observed a 50 percent increase in the percentage of confirmed crashes when speeds were faster than 70 mph. And there’s been a 30 percent increase in motorists driving at least 100 mph during some portion of their journey.
The mixed findings jibe with a jumbled picture of safety emerging from different parts of the country.
Researchers from the University of California, Davis say crashes and traffic deaths fell by half during the first three weeks of the state’s shutdown compared with the same period a year earlier, resulting in an estimated savings to the state of $40 million per day.
The reduction amounts to roughly 15,000 fewer collisions per month and 6,000 fewer injuries or fatal accidents, directly attributed to California’s shelter-in-place rules.
But in Minnesota, the pace of fatal crashes has increased since a stay-at-home order went into effect March 16. As of April 21, the state had recorded 35 roadway deaths, up from 29 in the same time frame the previous year.
In New York City, the number of speeding tickets issued by automated traffic cameras nearly doubled from 12,672 to 24,765 from February to March, according to the Governors Highway Safety Association.
There are many questions about how transportation will recover from COVID-19-related disruptions. Hallgren said he believes the changes are as much a reset as a recovery.
“I have a hard time thinking this goes back the same way,” he said.
“So when I think about our business and these opportunities, I think about, ‘How can we transform transportation and the insurance industries?’ There’s no better time than now.”