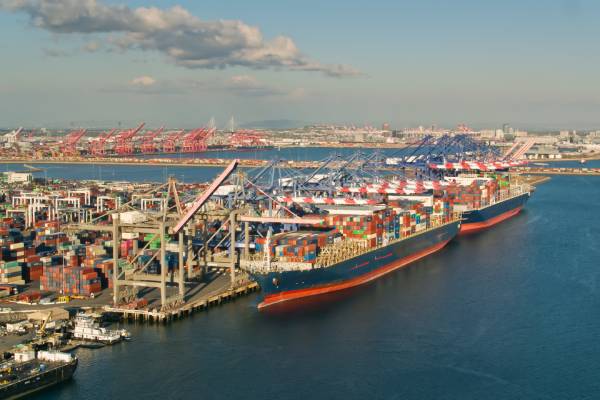
Container ports play a crucial role in global trade, handling millions of twenty-foot equivalent units (TEUs) annually. In 2024, the Port of Los Angeles retained its position as North America’s busiest container port, with over 9.3 million TEUs, while the Port of Long Beach followed closely with 8.7 million TEUs. The rankings, published on AJOT.com, highlight shifting trade flows, the resilience of major gateways, and the impact of major disruptions, such as the Francis Scott Key Bridge collapse in Baltimore.
| Rank | Port | State | 2024 TEUS | Data/Date |
| 1 | Port of Los Angeles | CA | 9,375,735 | 2024 |
| 2 | Port of Long Beach | CA | 8,788,718 | Jan-Nov |
| 3 | Port of New York/New Jersey | NY/NJ | 7,290,743 | Jan-Oct |
| 4 | Port of Savannah (GA ports) | GA | 5,103,417 | Jan-Nov |
| 5 | Port of Houston | TX | 3,799,573 | Jan-Nov |
| 6 | Port of Virginia | VA | 3,499,639 | FY 2024 |
| 7 | Port of Vancouver | BC-CA | 3,200,415 | Jan-Nov |
| 8 | Port of Seattle-Tacoma (NWSA) | WA | 3,035,986 | Jan-Nov |
| 9 | Port of Charleston | SC | 2,299,125 | Jan-Nov |
| 10 | Port of Oakland | CA | 2,080,275 | Jan-Nov |
| 11 | Port of Montreal | QUE-CA | 1,341,352 | Jan-Nov |
| 12 | Port of Jacksonville | FL | 1,340,412 | FY 2024 |
| 13 | Port of Miami | FL | 1,089,443 | FY 2024 |
| 14 | Port of Everglades | FL | 1,087,112 | FY 2024 |
| 15 | Port of Philadelphia (PhilaPort) | PA | 840,751 | 2024 |
| 16 | Port of Prince Rupert | BC-CA | 704,318 | Jan-Nov |
| 17 | Port of Baltimore* | MD | 559,715 | Jan-Oct |
| 18 | Port of New Orleans | LA | 500,199 | 2024 |
| 19 | Port of Halifax | NS-CA | 367,347 | Jan-Oct |
| 20 | Port of Wilmington | NC | 295,000 | 2024 |
Key Takeaways from 2024’s Port Rankings
- Los Angeles and Long Beach Remain on Top: The Port of Los Angeles and Port of Long Beach continue to dominate, collectively handling over 18 million TEUs. Despite previous concerns over labor negotiations and cargo shifts, both ports saw strong year-over-year growth.
- The East Coast’s Strength: New York/New Jersey remains the busiest East Coast port, handling 7.2 million TEUs, while Savannah, Houston, and Virginia continue to solidify their roles as major trade gateways.
- Gulf Coast and Canadian Ports Make Gains: Houston saw continued growth, reflecting its importance in energy exports and supply chain diversification. Canadian ports, including Vancouver, Montreal, and Prince Rupert, handled significant volumes, benefiting from trade with Asia.
Baltimore’s Decline After the Francis Scott Key Bridge Collapse
Baltimore’s ranking dropped significantly in March 2024 due to the impact of the Francis Scott Key Bridge collapse, which disrupted operations and led to diversions to nearby ports like Philadelphia and Norfolk. With only 559,715 TEUs handled by October, Baltimore fell outside the top 10—a stark contrast from previous years. Reconstruction efforts are underway, but full recovery remains uncertain.
Looking Ahead
With supply chain shifts, infrastructure investments, and port expansions continuing, the competition among major container hubs will remain dynamic. While West Coast ports are rebounding, East Coast and Gulf Coast ports are expanding their market share, reflecting ongoing changes in global trade patterns.